

On February 28, 2020, Safe Work Australia released the 2019 Psychosocial health and safety and bullying in Australian workplaces’ annual statement.
Psychosocial health is the physical, mental and social state of a person. The nationally accepted definition of workplace bullying is the repeated and unreasonable behaviour directed towards a worker or a group of workers that creates a risk to health and safety’ (Fair Work Act 2009, s.789FD(1).
Workplace bullying occurs when:
- An individual or group of individuals repeatedly behaves unreasonably towards a worker or a group of workers at work,
and - The behaviour creates a risk to health and safety.
The following behaviours could also be considered as bullying, based on cases heard:
- Aggressive and intimidating conduct.
- Belittling or humiliating comments.
- Victimisation.
- Spreading malicious rumours.
- Practical jokes or initiation.
- Exclusion from work-related events, and
- Unreasonable work expectations.
Reasonable management action conducted in a reasonable manner does not constitute workplace bullying.
This report presents the statistics of workers compensation claims when the work-related injury or disease resulted from the person experiencing mental stress or being exposed to mentally stressful situations. The report excludes assault cases where the physical injuries were considered more serious than the mental stress involved in the incident.
The mental stress claims data includes a sub-category for work-related harassment and/or workplace bullying. This sub-category is given to claims when the employee was a victim of:
- Repetitive assault and/or threatened assault by a work colleague or colleagues, or
- Repetitive verbal harassment, threats, and abuse from a work colleague or colleagues.
This is the fifth annual national statement issued by Safe Work Australia.
Note: Data presented for mental stress are national figures but data for subcategories of mental stress exclude Victoria because Victorian data is not coded to that level of detail.
Key statistics in the report
Rates for both mental stress and harassment and/or bullying claims have risen over the last two years but they are less than the peak in 2010-11. Jurisdictional legislation is highly likely to have influenced the scope of claims involving mental stress over the reporting period.
Figure 1. Number, time lost, direct cost, frequency rate and incidence rate for mental stress claims, 2016-17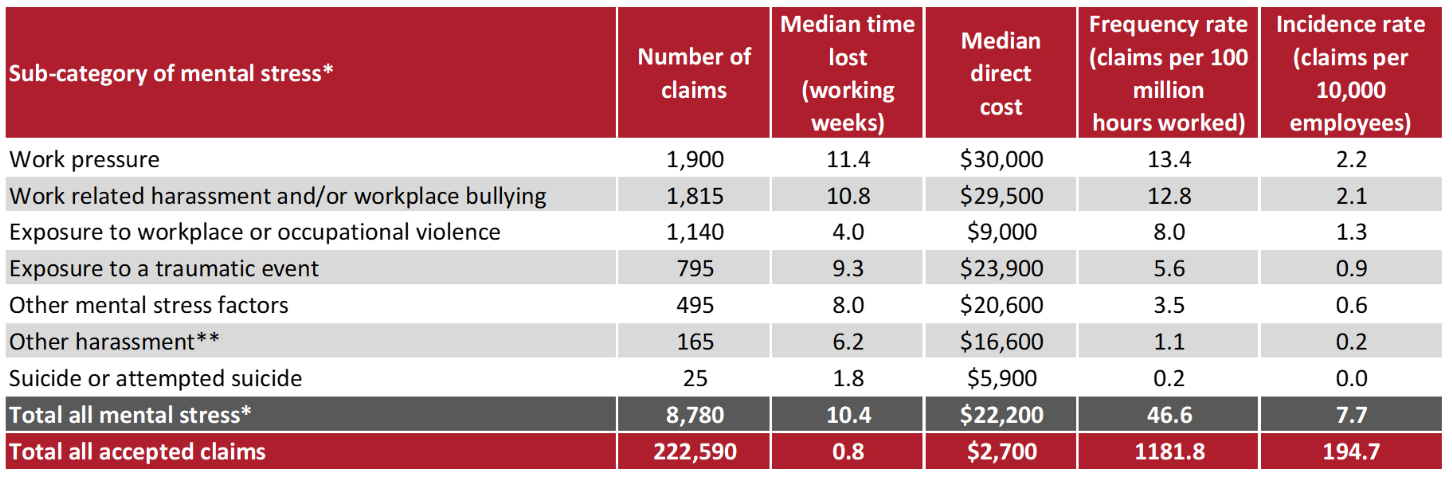
*Victoria only provides data on the top-level category of mental stress claims, so is included in the total but not the breakdown of subcategories. As a result, figures for the total mental stress claims may not equal the sum of columns.
**The Other harassment sub-category includes victims of sexual or racial harassment by a person or persons including work colleague/s.
Notes:
- The mechanism of incident classification identifies the overall action, exposure or event that best describes the circumstances that resulted in the most serious injury or disease.
- In previous statements, the amount of median compensation paid were calculated after excluding zero dollar’ claims. In this report, all serious claims (including zero dollar’ claims) have been included in calculations.
Claims for harassment and/or bullying made by female employees were more than twice as high as the rate of these claims made by males over the three years 2015-16 to 2017-18 combined. Similarly, the rates for claims made by females relating to work pressure and exposure to workplace or occupational violence were more than twice that of similar claims made by males.
Figure 2. Frequency rates by sex and mental stress sub-category, 2015-16 to 2017-18p combined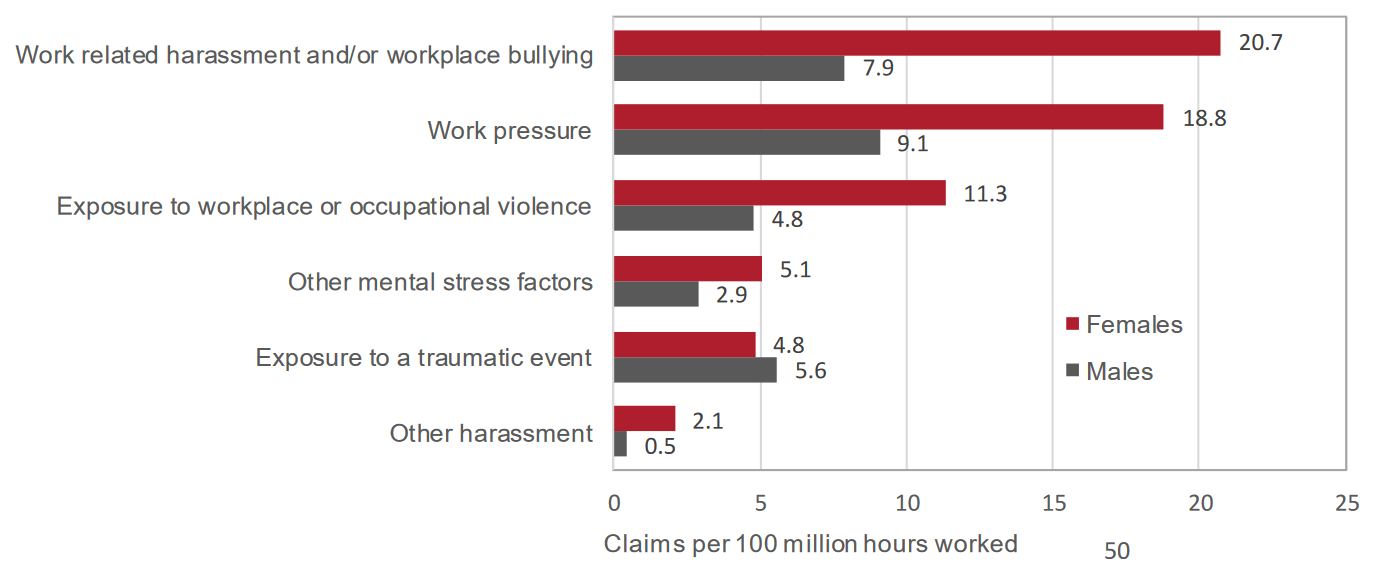
Note: Data presented for mental stress are national figures but data for subcategories of mental stress exclude Victoria because its data are not coded to that level of detail.
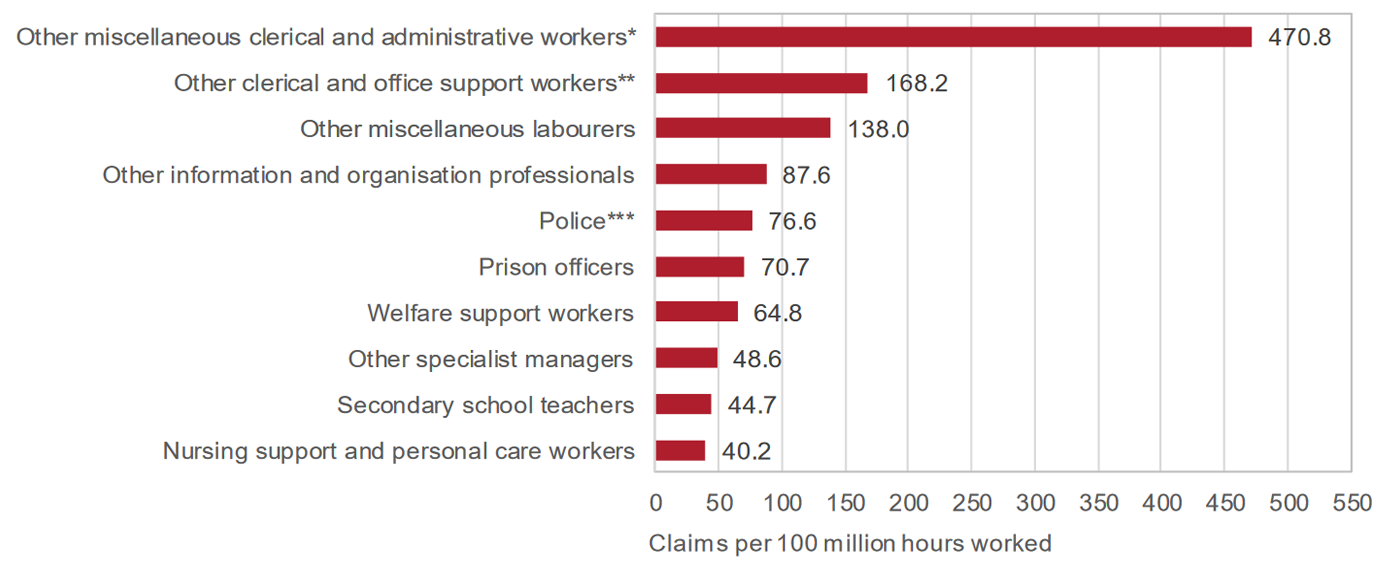
Occupations with a high risk of exposure to work-related harassment and/or workplace bullying include:
- Other miscellaneous and administrative workers*(includes coding clerks, production assistants, proof readers, radio dispatchers & examination supervisors.
- Other clerical and office support workers group** includes classified advertising clerks, meter readers & parking inspectors.
- Other miscellaneous labourers.
Figure 3. Top 10 occupations with the highest frequency rates of work-related harassment and/or bullying, 2015-16 to 2017-18 combined.
*** Police in Western Australian are covered by a separate workers’ compensation scheme and not included in the data.
Notes:
- Industries are limited to those associated with more than 50 claims.
- Data presented for mental stress are national figures but data for subcategories of mental stress exclude Victoria because its data are not coded to that level of detail.
Industry groups with high rates of claims involving work-related harassment and/or workplace bullying include Public order and safety services; Civic, Professional and other interest group services; and Residential care services.
4. Top 10 industry groups with the highest frequency rates of work-related harassment and/or bullying, 2015-16 to 2017-18 combined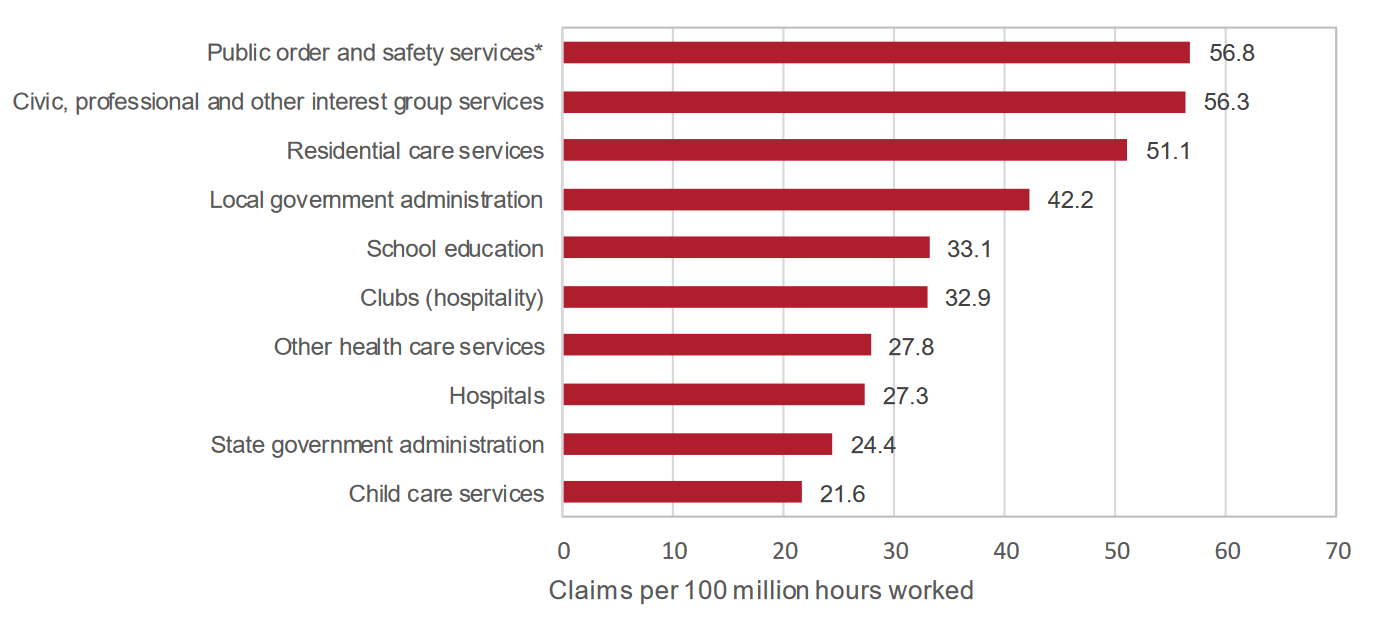
* Police in Western Australian are covered by a separate workers’ compensation scheme and not included in the data.
Notes:
- Industries are limited to those associated with more than 50 claims.
- Data presented for mental stress are national figures but data for subcategories of mental stress exclude Victoria because its data are not coded to that level of detail.
Sources:
Safe Work Australia
https://www.fwc.gov.au/issues-we-help/bullying
![]()
Fair Work Commission
https://www.fwc.gov.au/anti-bullying-benchbook/what-workplace-bullying
Want to elevate your leadership capacity?
Safety Dimensions offers accredited and non-accredited leadership training for emerging leaders. Through our training, you'll learn how to effectively communicate, set clear priorities, build team cohesiveness and implement operational plans and continuous improvement.
Want this program customised for your workplace and industry?
Call 03 9510 0477 or email [email protected]

Work-related fatigue: a guide for employers from WorkSafe Victoria
WorkSafe Victoria has produced a guide on how to prevent workplace injuries to employees. According to the guide, "Fatigue is an acute and/or ongoing state of exhaustion that leads to physical, mental or emotional exhaustion and prevents people from functioning safely...
5 tips for working successfully with subcontractors
Organisations are increasingly including subcontractors in their internal training, so everyone is aligned under a single Health & Safety framework. Not only is this beneficial for alignment of safety behaviours, but from a WHS compliance perspective, you have a...

Undertaking a COVID-19 Risk Assessment for your workplace
Have you undertaken a current risk assessment to identify the risks associated with exposure to COVID-19 in your workplace? Safe Work Australia has published a downloadable checklist you can follow with the key considerations for identifying risks and control...